Topic

Observability

All digests tagged Observability

NVIDIA, Docker & Hud on Agents in Production thumbnail

· 10:04

NVIDIA, Docker & Hud on Agents in Production

The discussion explores the operational challenges of deploying AI agents in a production environment (24/7 operation). Key insights emphasize that successful agent deployment requires shifting focus from root cause analysis to comprehensive context and observability. Speakers covered topics including using agents with combined data sources (Elastic logs + ServiceNow), redesigning automated fixes for human consumption, optimizing GPU utilization during tool calls, and leveraging AI-built tracing frameworks for debugging rare bugs.

Key takeaways

  1. Context over Root Cause Analysis 2:10

    When agents are running 24/7 in production, the most critical resource is context—understanding what changed yesterday and the relationships between services. This proactive data knowledge is more valuable than traditional root cause analysis.

  2. Automated Fixes Must Convince Humans 5:40

    Simply automating investigations and opening pull requests (PRs) for high-impact fixes is insufficient, as developers often ignore them. The output must be rebuilt to convince the human developer of its value and priority.

  3. GPU Idle Time During Tool Calls 7:10

    A counterintuitive finding is that when an agent makes a tool call, the GPU sits idle. Properly accounting for this CPU-intensive period allows users to serve roughly twice as many users compared to benchmark predictions that ignore tool calls.

  4. AI-Built Tracing Frameworks 9:00

    For debugging rare bugs, the most useful investment is getting AI to build a tracing framework. Providing traces from an overnight run allows the agent to pinpoint the exact problem rather than guessing or failing to reproduce the issue.
Watch on YouTube Full article

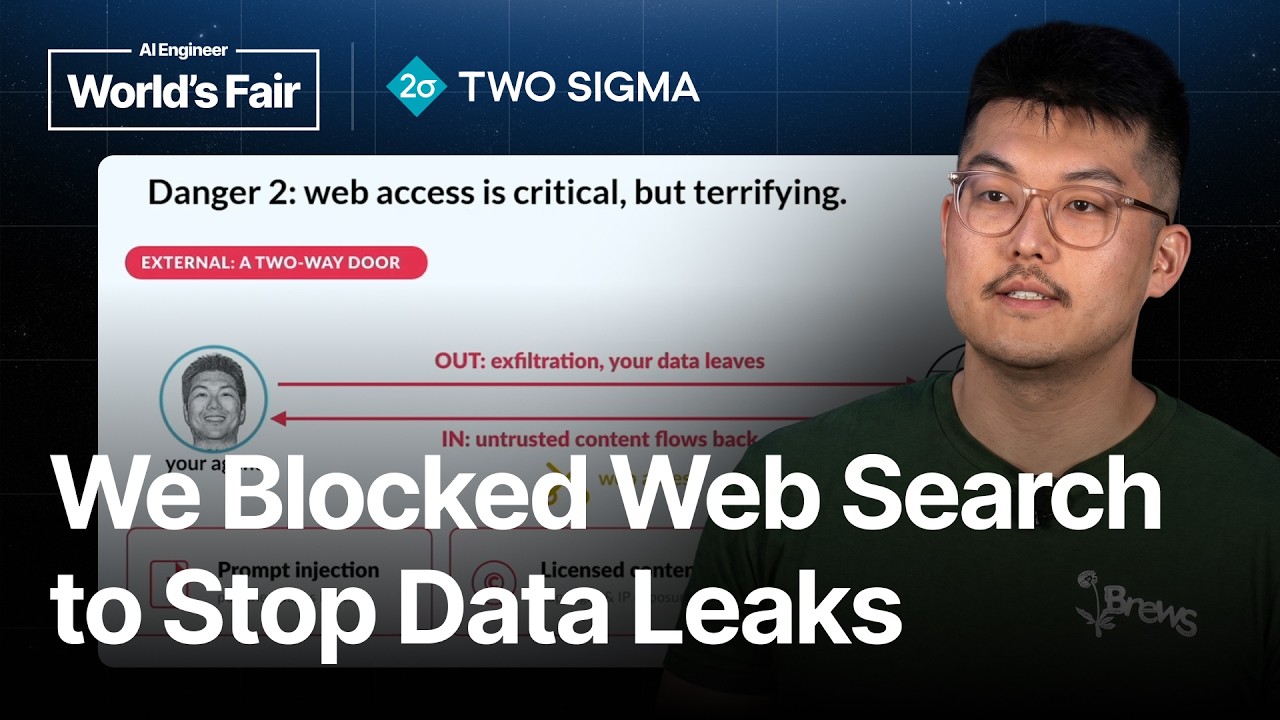
Tethered: Our Agents Are Us — Shu Fang, Two Sigma thumbnail

· 21:10

Tethered: Our Agents Are Us — Shu Fang, Two Sigma

Two Sigma implemented a framework allowing every employee to run cloud agents using their own unique user identity, addressing the challenges of permissions drift and maintaining security in a highly regulated environment. The solution leverages existing Kubernetes infrastructure (dedicated namespaces per person) and introduces two critical guardrails: propagating a trace header for full action provenance, and utilizing Google's web grounding for enterprise—a restricted search index that eliminates external egress vulnerabilities while accepting a data freshness constraint of up to 24 hours.

Key takeaways

  1. Running Agents as User Identity 2:00

    By running agents with the user's exact identity, the system bypasses conventional constraints like permissions drift and licensing issues associated with separate machine identities. This capability was supported by pre-existing infrastructure: a Kubernetes namespace per individual in every region, where automated jobs already ran using the user's identity via a sidecar mounting mechanism.

  2. Ensuring Action Provenance (Attribution) 8:37

    To differentiate between actions taken by the human and those performed by the agent, a dedicated header is propagated throughout the system. This trace ID allows for full provenance tracking, enabling the replay of the entire chain of actions leading to an end result, which is superior to simple identity verification.

  3. Securing Web Access with Grounding 9:18

    To mitigate risks like exfiltration and prompt injection from open web access, the firm adopted Google's 'web grounding for enterprise.' This service provides search and fetch capabilities within the internal VPC network boundary, while blocking native tools (e.g., Brave web browser) to ensure all requests route through the controlled index.

Watch on YouTube Full article

Aspire 13: One AppHost, Many Languages, Fewer Headaches? - Chris Ayers - NDC Toronto 2026 thumbnail

· 52:34

Aspire 13: One AppHost, Many Languages, Fewer Headaches? - Chris Ayers - NDC Toronto 2026

Aspire AppHost provides a unified orchestration layer for polyglot systems, allowing developers to treat mixed-stack projects (e.g., .NET API, Python worker, Node front end) as a single product rather than multiple disconnected repositories. The system simplifies local development by automating service wiring, managing configuration via environment variables, and providing a centralized dashboard for unified telemetry, logging, and debugging across diverse languages.

Key takeaways

  1. Unified Polyglot Orchestration 2:00

    Aspire AppHost allows developers to declare services, dependencies, and resources in one place, eliminating the need for scattered configuration files (YAML, appsettings.json) and complex manual setup scripts.

  2. Centralized Observability 3:30

    The dashboard provides a single pane of glass to view telemetry, structured logs, traces, and metrics from all connected services, greatly simplifying debugging across different language stacks.

  3. Automated Service Wiring & Discovery 5:40

    Service discovery is handled automatically using conventions (e.g., `services_` or `connections_`), ensuring that services can find and connect to dependencies (like databases) without manual IP/port configuration.

  4. AI-Assisted Development Workflow 9:40

    New agent capabilities allow developers to manage environments, query logs, debug failures, and even suggest code fixes directly within the chat interface (e.g., using VS Code Copilot).

Watch on YouTube Full article

Agents Are Where Microservices Were in 2015 — Roberto Milev & Uday Kanagala, Navan thumbnail

· 19:28

Agents Are Where Microservices Were in 2015 — Roberto Milev & Uday Kanagala, Navan

The talk outlines that AI agents represent a paradigm shift comparable to microservices in 2015, requiring entirely new architectural patterns for reliable production deployment. Key areas of focus include managing agent statefulness (moving beyond stateless APIs), implementing advanced observability via hooks and traces, adopting skills as the primary unit of context, and establishing robust governance through guardrails at the policy layer. The industry is moving toward scoring non-deterministic trajectories rather than asserting fixed outputs.

Key takeaways

  1. Agents are Stateful by Nature 3:54

    Unlike traditional stateless API services, agents require persistent sessions and state management, necessitating specialized agentic runtimes (e.g., AWS Agent Core Runtime) [2:34].

  2. Skills as Context Unit 6:04

    To manage context effectively, the focus should be on treating 'skills'—which include instructions and tool execution logic—as pluggable units of work that allow for progressive disclosure of context [6:04].

  3. Observability via Hooks and Traces 7:16

    Because agents emit excessive thinking output, traditional logging fails. Operational reliability requires intercepting every step (pre-tool/post-tool, pre-decision/post-decision) to capture auto-traces, goals, reasoning, belief status, and confidence scores [7:16].

  4. Testing Non-Deterministic Systems 9:32

    Since agents are non-deterministic, testing must shift from asserting fixed outputs to scoring trajectories—evaluating the efficiency and completeness of the path taken toward a goal [9:32].

  5. Guardrails for Authorization 13:44

    The blurring line between an agent acting on behalf of a user versus using its own service account requires fine-grained authorization policies (guardrails) applied before and after every tool call to prevent sensitive data leakage [13:04].

Watch on YouTube Full article

How to trace your vibe-coded agent with W&B Weave thumbnail

· 7:22

How to trace your vibe-coded agent with W&B Weave

The video demonstrates how to implement comprehensive observability for AI agents using Weights & Biases (W&B) Weave and the W&B MCP server. By leveraging the `weave for agents SDK`, engineers can add full tracing—including conversations, turns, LLM calls, and tool executions—to an existing agent's logic without modifying its core code. This instrumentation allows developers to monitor performance metrics, track resource usage (tokens, cost), and debug complex interactions, such as identifying model hallucinations.

Key takeaways

  1. Weave provides deep observability for AI agents

    The tracing structure follows a clear hierarchy: Agent $\to$ Conversation $\to$ Turn $\to$ LLM Call + Tool Call. This detailed view is crucial for understanding agent behavior and performance.

  2. Non-invasive instrumentation using W&B MCP

    Observability can be added by prompting a coding assistant (like Claude Code) to inject the necessary tracing logic via the `weave for agents SDK`, avoiding changes to existing application code.

  3. Debugging and Evaluation Capabilities

    The Weave UI allows engineers to inspect individual conversations and turns, providing step-by-step visibility into tool usage (e.g., Tavali search) and LLM decisions. This is critical for debugging hallucinations or unexpected agent behavior.

Watch on YouTube Full article

MCPs for Observability Stacks thumbnail

· 24:28

MCPs for Observability Stacks

This session details how MCP servers enhance traditional observability stacks by integrating AI capabilities for proactive system management. By correlating metrics, logs, traces, and events, MCPs allow engineers to move beyond reactive monitoring. Key features include automated anomaly detection (using techniques like setting business boundaries), natural language querying, and the use of 'skills'—reusable playbooks that guide AI agents through complex tasks such as root cause analysis, metric cleanup, and model selection for time series forecasting.

Key takeaways

  1. Shift to Proactive Observability 1:45

    The goal of modern observability is to move from reactive incident response to proactive anomaly detection, aiming to reduce Mean Time To Resolution (MTTR) by correlating telemetry across the entire stack.

  2. MCP's Role in Analysis 3:25

    MCP servers enable AI agents to query and correlate data, automating root cause analysis. This capability replaces manual dashboard navigation and complex query writing using natural language prompts.

  3. Advanced Anomaly Detection 5:18

    Anomaly detection identifies unusual patterns (spikes or drops) that deviate from expected behavior. Accurate detection requires defining 'business boundaries' to provide necessary context for the model.

  4. Automated Workflow and Model Selection 17:08

    MCPs can use specialized 'skills' (reusable playbooks) to perform complex tasks. For instance, an AI assistant can analyze a query's time series characteristics and recommend switching between forecasting models (e.g., from Prophet to IMADS online).

Watch on YouTube Full article

Improving Agents is a Data Mining Problem — Vivek Trivedy, LangChain thumbnail

· 20:02

Improving Agents is a Data Mining Problem — Vivek Trivedy, LangChain

The continuous improvement of autonomous agents requires shifting focus from code determinism to data mining agent traces. The speaker argues that observability and continual learning are fundamentally linked: an agent's actions in an environment generate a trace record that serves as the substrate for all future improvements. Techniques like harness engineering, distillation (SFT), and analyzing counterfactual traces allow developers to systematically improve agents at lower costs than relying solely on frontier models.

Key takeaways

  1. Shipping is the First Step

    To gather data for improvement, an agent must be deployed into a real-world environment (shipping it). This process generates valuable trace data from tool calls, API usage, and CLIs.

  2. Observability = Continual Learning 4:04

    There is a tight coupling between observability and continual learning for agents. Both require comprehensive traces—the record of actions taken in the environment—to allow the agent to update its internal knowledge or definition.

  3. The Value of Traces 6:00

    Traces capture fine-grained behavior that simple pass/fail benchmarks miss. They are crucial for proving counterfactuals (e.g., comparing GPT 5.5 vs. GLM 5.2) and understanding how agents behave at a granular level.

  4. Improvement Loop Strategy 13:00

    For agent improvement, the recommended loop is: Start with Harness Engineering (fast feedback, ~2 minutes) $\rightarrow$ Saturate this ceiling $\rightarrow$ Fine-tune the model to break through it $\rightarrow$ Return to Harness Engineering.

  5. The Future of Data 17:00

    Agent activity will generate data at an exponential rate, potentially eclipsing all human-produced data in history. Managing this requires building systems that can efficiently mine and process traces.

Watch on YouTube Full article

Always-on agents run production without the on-call tax — Justin Smith, Resolve AI thumbnail

· 24:56

Always-on agents run production without the on-call tax — Justin Smith, Resolve AI

The talk introduces the concept of 'always-on agents' designed to automate operational tasks in complex production environments, thereby reducing the burden of manual on-call work. While CI/CD handles baseline checks well, the biggest gap is monitoring non-alerted changes—such as feature flag rollouts or infrastructure updates—that require continuous context understanding. Background agents can run autonomously (on schedules, events, or messages) to perform deep analysis, root cause investigations, and proactive health checks across systems like Kafka pipelines.

Key takeaways

  1. The Operational Bottleneck 2:05

    A significant portion of an engineer's time (estimated at 70%) is spent running code in production—maintaining platforms, debugging incidents, and handling alerts—rather than writing it. This complexity increases with the velocity of change driven by AI.

  2. Background Agents vs. Incident Response 10:40

    While on-call agents handle immediate alerts and incidents, background agents address the 'long tail' of operational work—such as routine health checks, summarizing handoffs, or watching for subtle performance drifts (e.g., P99 drift) that don't trigger an alert.

  3. The Importance of Context 12:00

    Execution is easy; production context is hard. The value lies in building knowledge systems that can determine if a metric 'smells wrong' or understand the causal chain impact of a change, rather than just loading a dashboard.

Watch on YouTube Full article

Voice Agent observability with LangSmith thumbnail

· 7:38

Voice Agent observability with LangSmith

This session details how to implement robust observability for voice agents built using the Google ADK and Gemini Live model by integrating LangSmith tracing. The process involves defining a custom plugin that captures not only the conversation transcript but also the full audio stream (user input and agent output). This visibility allows engineers to debug complex interactions, analyze tool usage, track interruption events, and monitor token-level costs for production readiness.

Key takeaways

  1. Gemini Live Model Functionality

    Gemini Live is Google's native audio model that operates in a speech-to-speech manner. It takes audio directly as input and produces audio as output without transcribing to text, resulting in low latency and natural, emotive voice quality.

  2. LangSmith for Observability 2:05

    LangSmith is a platform built by LangChain specifically for AI agent observability and evaluations. It provides visibility into the internal workings of the voice agent, which is crucial for safe production deployment.

  3. Capturing Conversation Audio 4:00

    To ensure the 'source of truth' for a voice interaction is captured, the tracing setup must include functions to record both user audio and agent audio. Recording agent audio requires careful placement (e.g., using a `set play callback` on the audio out class) to capture only what the user actually heard.

Watch on YouTube Full article

From Signal to PR: Anatomy of a Self-Improving Agent — Jason Lopatecki, Arize thumbnail

· 20:36

From Signal to PR: Anatomy of a Self-Improving Agent — Jason Lopatecki, Arize

The future of observability is shifting from human-driven dashboards to machine-readable telemetry that powers autonomous AI agents. Arize's Signal automates the debugging process by pulling deep production traces and logs (sometimes ten megabytes) directly into the repository as files. This allows coding harnesses, like Claude Code, to understand the exact code path taken during an error, enabling agents to propose fixes and creating a continuous loop where systems can autonomously improve themselves. The human role is evolving from responder to reviewer.

Key takeaways

  1. Observability Shift (2.0) 2:16

    Observability is moving beyond UI clicks and graphs; it's becoming a 'smoke'—telemetry data that agents can read to debug software, allowing for continuous automated fixing.

  2. The Key Unlock: Traces on Filesystem 6:08

    The critical breakthrough is pulling relevant production traces and logs down as files into the repo. Coding agents are highly effective with file formats, giving them the exact code path rather than guessing among millions of branches.

  3. Autonomous Fixing Loop 6:54

    The goal is to build systems that autonomously fix themselves. The process involves an agent investigating first, gathering deep evidence (traces/logs), and proposing a fix before human intervention.

  4. Security and Deployment

    To ensure compliance for large enterprises (e.g., Uber, Booking), agents must run within the customer's Virtual Private Cloud (VPC) using sandboxes, preventing production systems from connecting directly to external models.

Watch on YouTube Full article

Inside the Agent Engine: A LangChain and Traversal Fireside Chat thumbnail

· 41:14

Inside the Agent Engine: A LangChain and Traversal Fireside Chat

The discussion details the challenges and architectural requirements for building AI Site Reliability Engineering (SRE) agents capable of handling petabyte-scale production incidents. Speakers emphasize that SRE troubleshooting is uniquely difficult due to the lack of labeled data, high stakes, and massive telemetry volumes. Successful agent design requires moving beyond simple RAG/vector search by implementing sophisticated 'agent harnesses' that manage context via file systems, build a comprehensive 'production world model,' and strategically balance offline vs. online computation.

Key takeaways

  1. SRE Agents Face Unique Data Challenges 3:23

    Troubleshooting is difficult because there is no good labeled data for LLMs to train on, human troubleshooting processes are complex, and the scale of telemetry (e.g., petabytes per day) makes traditional context window methods infeasible.

  2. Agent Architecture Requires a Core/Sub-Agent Harness 11:30

    Instead of monolithic agents, the recommended approach is building one core agent that orchestrates multiple specialized sub-agents. This requires a robust harness to manage context and file systems effectively.

  3. The Production World Model is Key to System Knowledge 7:50

    Learning system knowledge involves synthesizing large streams of non-telemetry data (e.g., code, Slack) with raw observability logs to build a 'production world model,' which acts as the system's deep wiki.

  4. Evaluation Must Focus on Hardest Tasks 30:50

    When evaluating agents, focus on the hardest tasks (like incident RCA) because success in these complex areas tends to generalize better than focusing on easier, less representative tasks.

Watch on YouTube Full article

The Agent Development Lifecycle 101 by Harrison Chase thumbnail

· 45:17

The Agent Development Lifecycle 101 by Harrison Chase

The Agent Development Lifecycle outlines a systematic approach for moving AI agents from isolated demos to reliable production systems. The process is broken down into five stages: Build, Test, Deploy, Monitor, and Govern. Key focus areas include ensuring agent reliability at scale by implementing durable execution, managing complex state via virtual file systems, and using advanced observability tools like tracing and online evaluation (evals) to detect failures and drive continuous improvement.

Key takeaways

  1. Systematic Iteration is Key 3:50

    Successful teams treat agents not as one-off projects but as systems requiring systematic iteration across the entire lifecycle: build, test, deploy, monitor, and improve. The primary challenge in shipping agents reliably at scale is ensuring consistent behavior.

  2. Agent Development Components 5:50

    The core components are Build (frameworks/harnesses), Test (data sets, metrics, benchmarks like Terminal Bench 2), Deploy (durable execution, sandboxes), Monitor (tracing, online evals), and Govern (cost control, tool access management).

  3. The Role of Tracing and Observability 17:06

    Tracing is fundamental for debugging agents, allowing developers to see the inputs and outputs at every step (including tool calls) to understand why an LLM or agent failed. Online evals extend this by scoring production traces without needing ground truth.

  4. Self-Improving Agents 31:30

    Advanced platforms, like LangSmith Engine, are beginning to automate the improvement loop. They run in the background over existing traces, clustering issues and suggesting fixes (code or prompt changes), thereby drastically lowering the burden of operating agents at scale.

Watch on YouTube Full article

Justin Cormack - When Tests Lie: Using Observability to Keep AI Honest - AI Native DevCon June 2026 thumbnail

· 32:04

Justin Cormack - When Tests Lie: Using Observability to Keep AI Honest - AI Native DevCon June 2026

The talk explores the challenges of using AI to build large-scale, complex distributed systems, exemplified by building an AWS S3 compatible object storage system in Rust. While testing is crucial, relying solely on achieving 100% test coverage is insufficient for complex systems. The speaker emphasizes that observability, robust test articles (like external services), and a 'human-in-the-loop' approach are necessary to enforce correctness, discover edge cases, and manage issues like race conditions and flaky tests in AI-assisted development.

Key takeaways

  1. Observability is Critical for Large Systems 17:47

    For complex distributed systems, the public API often doesn't cover all background behaviors. Observability techniques (like tracing) are necessary to infer or observe invisible behaviors that standard APIs cannot expose.

  2. Test Articles Provide Grounding 21:00

    Using an existing system, such as AWS S3, as a 'test article' provides a crucial behavioral baseline. This is more valuable than relying on documentation, which may be inaccurate.

  3. Beyond 100% Test Coverage 13:44

    Achieving 100% test coverage can lead to writing trivial or unhelpful tests. The focus should instead be on expanding the scope of testing and thinking like a QA professional to find edge cases.

  4. Flaky Tests Must Be Fixed 22:00

    The speaker asserts that flaky tests must be fixed immediately, as AI models may incorrectly suggest ignoring them based on training data. Running repeated test suites helps identify these issues.

Watch on YouTube Full article

Logs Are All You Need: Rethinking Observability with AI Agents thumbnail

· 46:40

Logs Are All You Need: Rethinking Observability with AI Agents

Sherwood Callaway introduces Sazabi, an AI-native observability platform designed to disrupt traditional tools like Datadog by focusing on logs as the primary source of truth. The core philosophy is that in the age of coding agents, engineers should interact with production data via natural language chat rather than complex dashboards. Key technical innovations include using Git for persistent agent memory across multiple threads and implementing a read-only sandbox environment to safely execute investigative tasks.

Key takeaways

  1. Logs are Sufficient: Rethinking Observability 22:20

    The traditional 'three pillars' (metrics, logs, traces) are considered overkill for modern agentic workflows. By focusing solely on logs, instrumentation becomes significantly simpler, requiring only basic logging statements, as the platform can reconstruct metrics and traces from log data.

  2. AI Agents Generate Alerts, They Don't Evaluate Them 28:00

    Instead of using AI to triage noisy alerts (alert fatigue), Sazabi autonomously generates actionable alerts directly from logs and codebase analysis. The agent determines what is meaningful to the user at runtime.

  3. Agent Memory via Git for Shared State 34:05

    Sazabi maintains persistent, shared memory across multiple parallel sub-agents and threads by committing findings (e.g., issue lists, facts) to a dedicated Git branch within the sandbox environment. This allows agents to benefit from collective findings.

  4. Sandbox Isolation and Read-Only Access 30:30

    The platform operates in a read-only system with no public internet access, ensuring security. All actions are routed through an isolated sandbox environment (e.g., using `bash` tools) to prevent data exfiltration or unauthorized changes.

Watch on YouTube Full article