Topic

Anomaly Detection

All digests tagged Anomaly Detection

MCPs for Observability Stacks thumbnail

· 24:28

MCPs for Observability Stacks

This session details how MCP servers enhance traditional observability stacks by integrating AI capabilities for proactive system management. By correlating metrics, logs, traces, and events, MCPs allow engineers to move beyond reactive monitoring. Key features include automated anomaly detection (using techniques like setting business boundaries), natural language querying, and the use of 'skills'—reusable playbooks that guide AI agents through complex tasks such as root cause analysis, metric cleanup, and model selection for time series forecasting.

Key takeaways

  1. Shift to Proactive Observability 1:45

    The goal of modern observability is to move from reactive incident response to proactive anomaly detection, aiming to reduce Mean Time To Resolution (MTTR) by correlating telemetry across the entire stack.

  2. MCP's Role in Analysis 3:25

    MCP servers enable AI agents to query and correlate data, automating root cause analysis. This capability replaces manual dashboard navigation and complex query writing using natural language prompts.

  3. Advanced Anomaly Detection 5:18

    Anomaly detection identifies unusual patterns (spikes or drops) that deviate from expected behavior. Accurate detection requires defining 'business boundaries' to provide necessary context for the model.

  4. Automated Workflow and Model Selection 17:08

    MCPs can use specialized 'skills' (reusable playbooks) to perform complex tasks. For instance, an AI assistant can analyze a query's time series characteristics and recommend switching between forecasting models (e.g., from Prophet to IMADS online).
Watch on YouTube Full article

Learned Execution Graphs for Anomaly Detection & Drift in APIs — Ritvik Pandya, JP Morgan Chase thumbnail

· 19:38

Learned Execution Graphs for Anomaly Detection & Drift in APIs — Ritvik Pandya, JP Morgan Chase

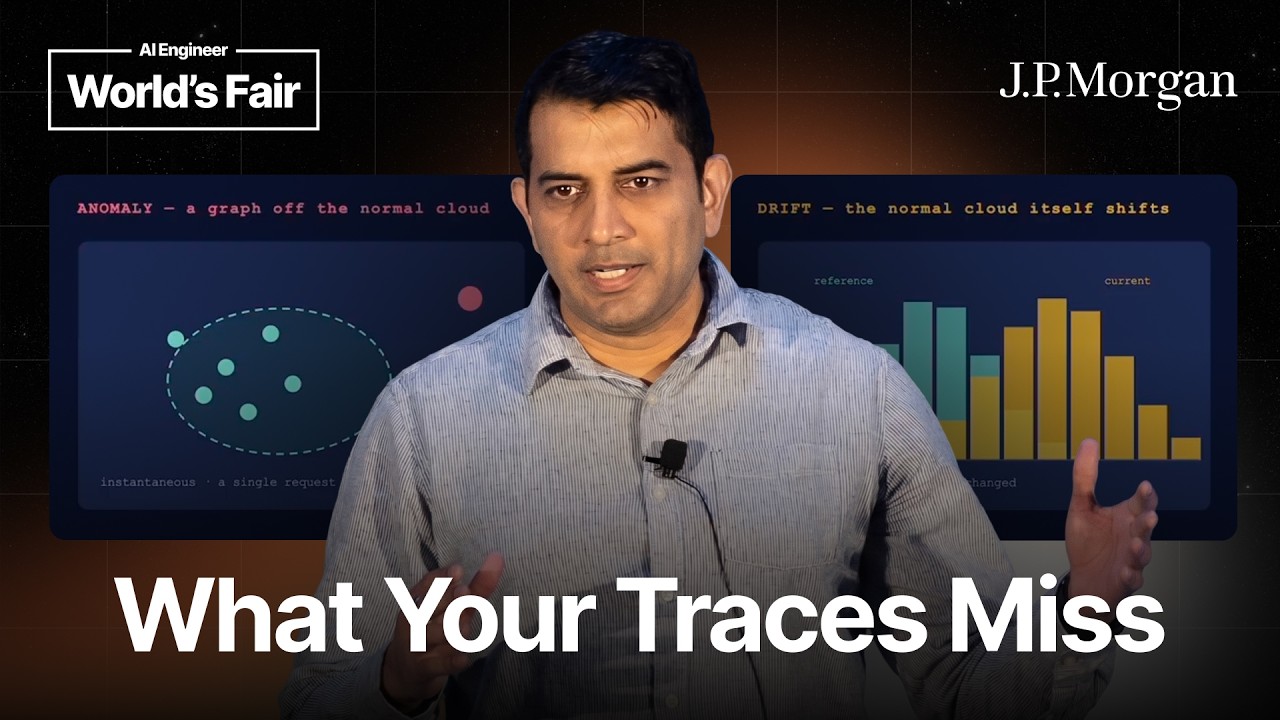
This talk details using short-lived execution graphs (DAGs) to monitor API request processing for advanced anomaly and drift detection. Instead of relying on traditional service level monitoring (SLM) that reports 'healthy' averages, this method models the entire request flow as a Directed Acyclic Graph (DAG). By comparing the actual execution graph against a learned baseline, it can pinpoint performance issues or skipped steps to specific nodes, drastically reducing root cause analysis time. The system differentiates between transient anomalies and persistent drift—categorizing drift into structural, volume, and covariate types—to ensure accurate alerting and proactive system re-baselining.

Key takeaways

  1. Execution Graphs for Monitoring

    Representing API request processing as a DAG allows holistic tracking of middleware steps, context passing, and execution order. This provides granular visibility beyond simple endpoint latency checks.

  2. Anomaly vs. Drift Detection 12:13

    The system distinguishes between sudden anomalies (e.g., traffic spikes) and slow drift—a gradual change in performance or pattern over time—which requires updating the baseline itself.

  3. Three Types of Drift 14:15

    Drift is categorized into structural (new/removed nodes), volume (expected request load changes), and covariate (changes in input data distribution, e.g., different currency types).

Watch on YouTube Full article