Learned Execution Graphs for Anomaly Detection & Drift in APIs — Ritvik Pandya, JP Morgan Chase
Summary
This talk details using short-lived execution graphs (DAGs) to monitor API request processing for advanced anomaly and drift detection. Instead of relying on traditional service level monitoring (SLM) that reports 'healthy' averages, this method models the entire request flow as a Directed Acyclic Graph (DAG). By comparing the actual execution graph against a learned baseline, it can pinpoint performance issues or skipped steps to specific nodes, drastically reducing root cause analysis time. The system differentiates between transient anomalies and persistent drift—categorizing drift into structural, volume, and covariate types—to ensure accurate alerting and proactive system re-baselining.
Key takeaways
-
Execution Graphs for Monitoring
Representing API request processing as a DAG allows holistic tracking of middleware steps, context passing, and execution order. This provides granular visibility beyond simple endpoint latency checks.
-
Anomaly vs. Drift Detection
12:13
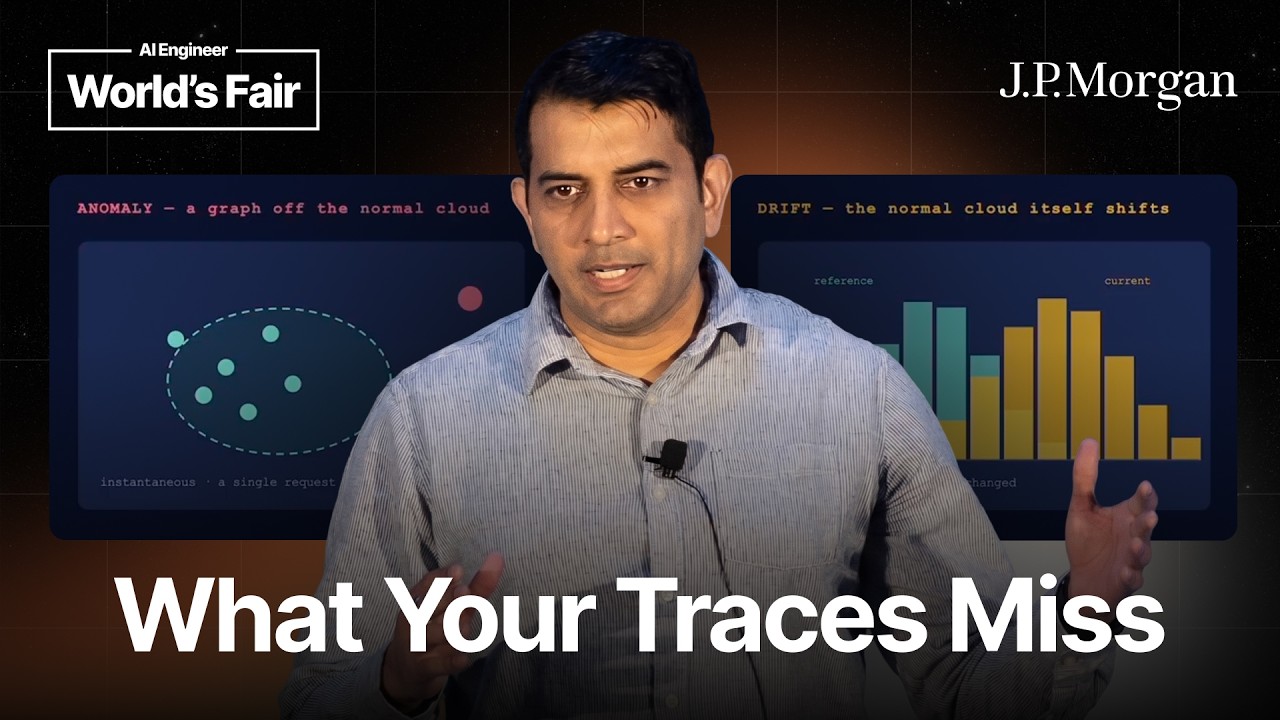
The system distinguishes between sudden anomalies (e.g., traffic spikes) and slow drift—a gradual change in performance or pattern over time—which requires updating the baseline itself.
-
Three Types of Drift
14:15
Drift is categorized into structural (new/removed nodes), volume (expected request load changes), and covariate (changes in input data distribution, e.g., different currency types).
Technical details
-
Execution Graphs & DAGs
0s
The core concept involves modeling the entire request flow as a Directed Acyclic Graph (DAG) to track execution order and context passing between nodes.
-
Monitoring Methodology
523s
The process is: 1. Represent request processing as a DAG. 2. Establish a baseline. 3. Detect deviation. 4. Localize the issue to a specific node (e.g., 'foreign transaction rate service').
-
Drift Detection Techniques
733s
Uses per-node baselines and statistical methods like KL divergence to detect shifts, rather than relying on single global thresholds.
Mentioned resources
- OpenTelemetry
- Neo4j
Channel & topics
Watch on YouTube · Back to latest
This independent, AI-assisted summary is provided for commentary and informational purposes. It may contain errors or omit important context. Please watch the original video for the creator's complete presentation. Video, thumbnail, and related copyrights belong to their respective owners.