
Topic

OpenTelemetry

All digests tagged OpenTelemetry

What Is MLflow? Tracing AI Agents & LLM Workflows thumbnail

· 9:38

What Is MLflow? Tracing AI Agents & LLM Workflows

This video details the necessity of advanced observability for multi-agent and LLM workflows, arguing that traditional monitoring (HTTP status, response time) is insufficient for diagnosing complex AI failures. MLflow is presented as an OpenTelemetry-compatible platform that captures detailed traces, allowing engineers to monitor not just request success, but the internal logic, tool usage, and quality of the AI's decision path. Key techniques include using LLM judges for non-deterministic evaluation and integrating quality gates into the CI pipeline.

Key takeaways

  1. Beyond Request-Level Monitoring

    Multi-agent systems require visibility into internal failures like silent tool failures, cascading latency, context overflow, and non-determinism, which standard monitoring dashboards cannot detect. (0:00)

  2. MLflow's Core Primitive: The Trace 0:47

    MLflow uses 'traces'—complete records of one request—composed of 'spans.' Each span details a single action (e.g., LLM call, DB query), capturing inputs, outputs, latency, and token counts. (0:47)

  3. Advanced Evaluation with LLM Judges 2:32

    For non-deterministic AI, MLflow allows using a second model (LLM Judge) to grade agent output against criteria like tool call correctness, relevance, and safety. (2:32)

  4. Production Deployment Best Practices 4:10

    For production, the tracking server must use a real database (e.g., Postgres/MySQL), asynchronous trace logging should be enabled, and sampling should be used to manage overhead. (4:10)
Watch on YouTube Full article

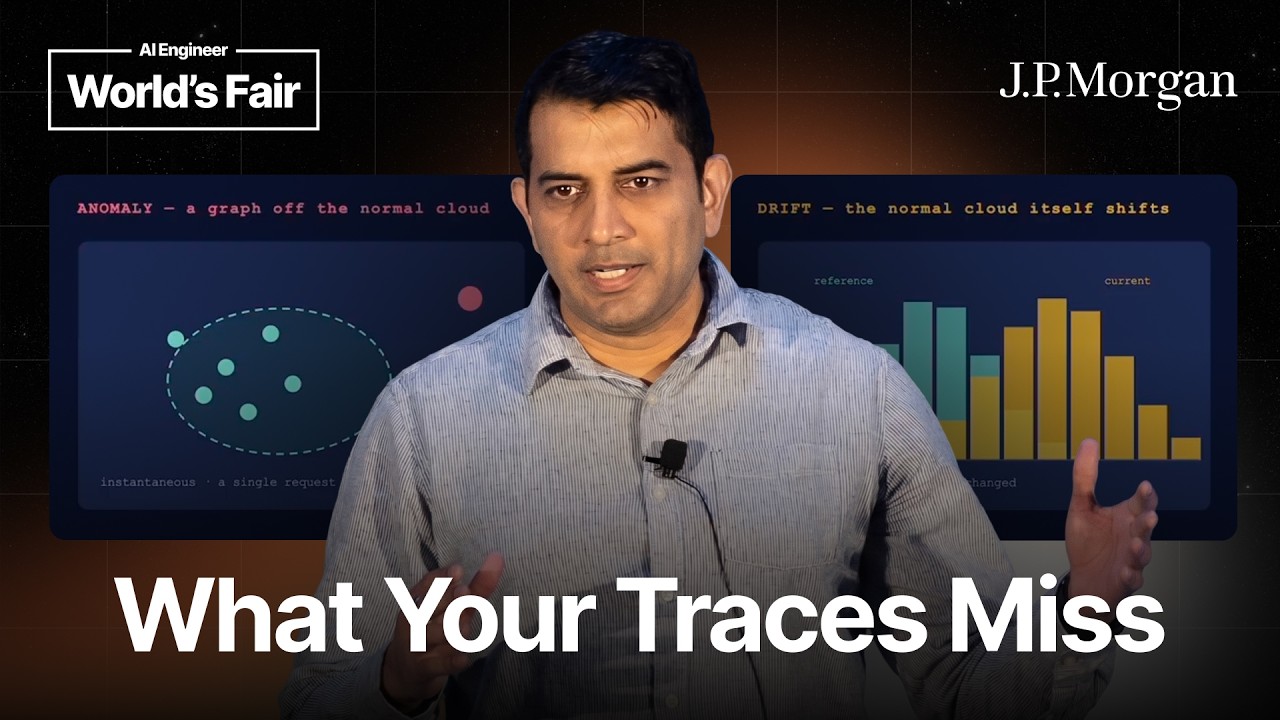
Learned Execution Graphs for Anomaly Detection & Drift in APIs — Ritvik Pandya, JP Morgan Chase thumbnail

· 19:38

Learned Execution Graphs for Anomaly Detection & Drift in APIs — Ritvik Pandya, JP Morgan Chase

This talk details using short-lived execution graphs (DAGs) to monitor API request processing for advanced anomaly and drift detection. Instead of relying on traditional service level monitoring (SLM) that reports 'healthy' averages, this method models the entire request flow as a Directed Acyclic Graph (DAG). By comparing the actual execution graph against a learned baseline, it can pinpoint performance issues or skipped steps to specific nodes, drastically reducing root cause analysis time. The system differentiates between transient anomalies and persistent drift—categorizing drift into structural, volume, and covariate types—to ensure accurate alerting and proactive system re-baselining.

Key takeaways

  1. Execution Graphs for Monitoring

    Representing API request processing as a DAG allows holistic tracking of middleware steps, context passing, and execution order. This provides granular visibility beyond simple endpoint latency checks.

  2. Anomaly vs. Drift Detection 12:13

    The system distinguishes between sudden anomalies (e.g., traffic spikes) and slow drift—a gradual change in performance or pattern over time—which requires updating the baseline itself.

  3. Three Types of Drift 14:15

    Drift is categorized into structural (new/removed nodes), volume (expected request load changes), and covariate (changes in input data distribution, e.g., different currency types).

Watch on YouTube Full article